Measuring time saved by AI tools
Claims that AI saves hours are easy to make and hard to check. A practical approach to measuring what actually changes before, during, and after rollout.
“Saves clinicians two hours a day.” “Cuts reporting time by 80%.” Claims like these are common in health and enterprise AI. They are rarely accompanied by a baseline, a comparison group, or a definition of what was measured. We would like to do better, and we think buyers should expect better.
This article sets out a practical approach to measuring the impact of AI tools on real work. It applies to clinical documentation, but also to data analysis, rehabilitation, and operational reporting.
Start with a baseline
You can’t measure change without knowing where you started. The baseline should be collected before rollout, over long enough to capture normal variation: busy weeks and quiet ones, different clinic types, and staff mix.
For clinical work, EHR event logs are a valuable source. Arndt and colleagues showed that EHR event-log data, validated against direct time-motion observation, can reliably describe how physicians spend their time. They found clinicians spent 5.9 hours of an 11.4-hour workday in the EHR, including 1.4 hours after clinic hours. Time-and-motion observation, as in Sinsky and colleagues’ study of four specialties, is more expensive but captures work outside the EHR.
Choose measures that match the claim
Each claim needs its own measure. Some examples:
| Claim | Primary measure | Supporting measures |
|---|---|---|
| Less documentation time | Time-in-note per visit (EHR logs) | After-hours EHR time; note length; edit volume |
| Less burnout | Validated survey instruments | Task-load measures; qualitative feedback |
| Faster analysis | Time from question to reviewed result | Rework rate; number of hand-offs |
| Better rehabilitation follow-through | Session adherence | Function scores; unplanned contacts |
| Faster operational review | Time to prepare weekly review | Questions answered without analyst help |
The randomised trial of two ambient AI scribes in NEJM AI is a useful model. Its primary outcome was a specific, log-based measure (change in time-in-note), while burnout and task load were secondary outcomes measured with established survey instruments. One tool reduced time-in-note by 9.5% compared with control; the other showed no significant change. That kind of clarity is what makes a result credible.
Compare with something
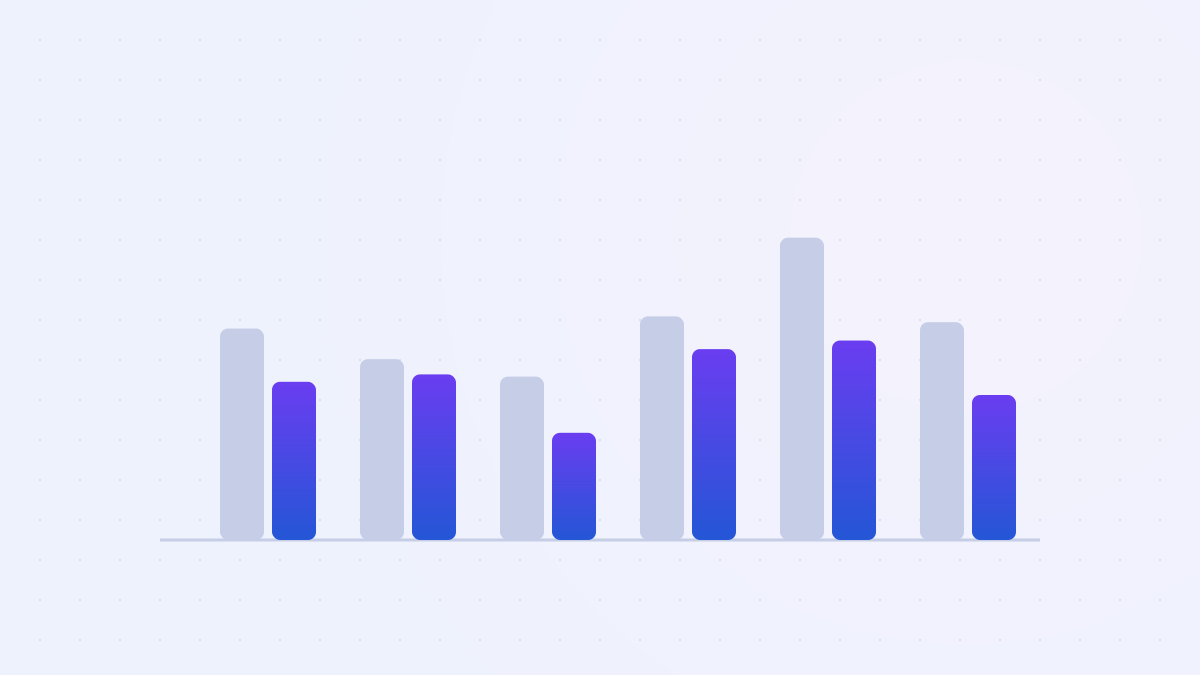
A before-and-after comparison is better than nothing, but it can be misleading. Seasonal changes, new staff, or an unrelated system upgrade can all shift the numbers. Stronger designs include:
- A concurrent comparison group: clinicians or sites not yet using the tool.
- Staggered rollout: different groups starting at different times, so time trends can be separated from the effect of the tool.
- Randomisation, where feasible and appropriate.
Pilot evaluations with surveys, like the Stanford ambient scribe pilot with 48 physicians, are valuable for learning about usability and experience. They are a step toward, not a replacement for, comparative evaluation of time and outcomes.
Measure quality alongside speed
Faster isn’t better if quality falls. Every time measure should have a quality partner:
- For documentation: note accuracy and completeness, audited against sources on a sample.
- For analysis: reproducibility. Can another person re-run the analysis and get the same result?
- For operations: correctness of answers, checked against a reference query.
- For rehabilitation: safety events and functional outcomes, not just engagement.
Watch for the hidden costs
Some costs don’t appear in the headline metric:
- Review time. A tool that drafts quickly but needs long review may not save much. Measure review, not just generation.
- Shifted work. Time saved by one role can reappear in another, such as IT support or data teams.
- Learning curves. Early weeks are often slower. Measure long enough to see the settled state.
- Vigilance drift. If edit rates fall over time, check whether quality is being maintained or reviewers are skimming.
Report it straight
When we report impact, we intend to state the measure, the baseline, the comparison, the time period, the setting, and the limitations, including results that didn’t go our way. We think it is the only kind of evidence worth putting in front of clinicians, patients, and healthcare leaders.
This article describes a measurement approach. AId Centric does not currently publish outcome figures for its own products on this site.
References
- Arndt BG, Beasley JW, Watkinson MD, et al. Tethered to the EHR: Primary Care Physician Workload Assessment Using EHR Event Log Data and Time-Motion Observations. Ann Fam Med. 2017;15(5):419–426. doi.org/10.1370/afm.2121
- Sinsky C, Colligan L, Li L, et al. Allocation of Physician Time in Ambulatory Practice: A Time and Motion Study in 4 Specialties. Ann Intern Med. 2016;165(11):753–760. doi.org/10.7326/M16-0961
- Lukac PJ, et al. Ambient AI Scribes in Clinical Practice: A Randomized Trial. NEJM AI. 2025;2(12). doi.org/10.1056/aioa2501000
- Shah SJ, et al. Ambient artificial intelligence scribes: physician burnout and perspectives on usability and documentation burden. J Am Med Inform Assoc. 2025;32(2):375–380. doi.org/10.1093/jamia/ocae295